
If you are a landlord wondering how tax changes Britain’s buy to let landscape, then try taking a look at an investment heat map of England and Wales for 2020.
The date coincides with when higher rate tax payers lose mortgage interest relief.
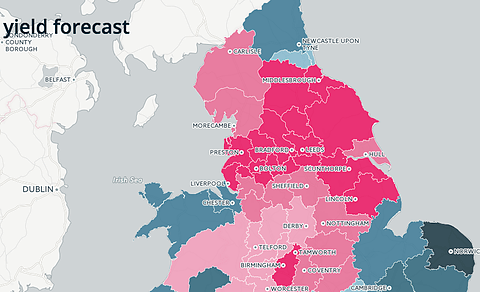
Put together by buy2let.com, the map shows rental yields for dozens of areas across the two countries.
The figures were calculated by merging analysis of property values, rents and other statistics from organisations as diverse as the Royal Institution of Chartered Surveyors and landlord insurer Homelet.
The web site has calculated gross rental yield by 2020 for buy to let homes.
The result, says the firm, is the only place south of Lincoln to show a high return for landlords is Birmingham.
The East Midlands, South Yorkshire and Cheshire are also chart highly, while the West and South Midlands, a swathe of Wales and Berkshire and North Hampshire (Basingstoke and Reading) are the only other places Manchester to return good yields.
London has a couple of boroughs with reasonable buy to let returns – around Basingstoke and the London borough of Ilford. Overall, the map shows a distinct North/South divide, which is for once in favour of the North, where just about every area except for the North-East around Newcastle upon Tyne showing good returns.
The map is an indicator and the analysis is only as good as the data, which has some issues over the relevance of samples and sample sizes.
“This a poll of polls from knowledgeable sources,” says the firm’s web site. “Of course, no one knows what lies ahead and the forecast is exactly that, just an estimation of what might happen.
“However, if the figures are right, the map shows some clear rental hotspots for landlords to consider when they make their next investment.”