

House prices are still rising, according to the latest official data from the Office for National Statistics (ONS). House Price Digest – July 2021
May saw a 9.6 per cent year-on-year increase – just shy of April’s figure of 10 per cent.
The average home price fell back a little to £255,000 from the record of £256,000 posted for March.
London has the lowest annual growth for the sixth month in a row. However, homes in the capital still went up in value by 5.2 per cent.
Since July 2020, house prices across the country have shot up in value thanks to Chancellor Rishi Sunak slashing stamp duty.
The significant discounts ended in June, but homebuyers can still cash in on discount rates until September 30.
No stamp duty is due on homes priced up to £250,000. The zero threshold falls to £125,000 from October 1.
“These changes in the tax paid on housing transactions may have allowed sellers to request higher prices as the buyers’ overall costs reduced,” says the ONS report.
“As the tax breaks were originally due to conclude at the end of March 2021, it’s likely that this inflated March’s average house prices as buyers rushed to ensure their house purchases completed ahead of this deadline.”
In March, HM Revenue & Customs data disclosed a record 183,670 homes changed hands. However, the number dropped to 119,540 in April and has stayed at that level until now.
Property portal Rightmove reports asking prices for homes coming to the market have hit a record high for the fourth month in a row.
The average asking price is £338,447 – an increase of £2,374 over May’s record of £336,073.
Tim Bannister, Rightmove’s Director of Property Data, comments: “We predict that the number of completed sales will be the highest ever seen in a single month when June’s data is released by HMRC later this week.
“This means it’s likely that the first half of 2021 has seen a record number of moves when compared with the first six months of any other year, induced by the pandemic’s side-effect of a new focus on what one’s home needs to provide.
“That is one of the driving forces behind four consecutive months of new record average property prices.”
Rightmove forecasts 800,000 homes had changed hands in the first half of the year, which may nudge over the previous record of 795,000 set in 2007 before the global financial crisis struck.
Contents
English house prices by region – May 2021
House prices are rising the fastest in the North West, with a year-on-year 15.2 per cent increase.
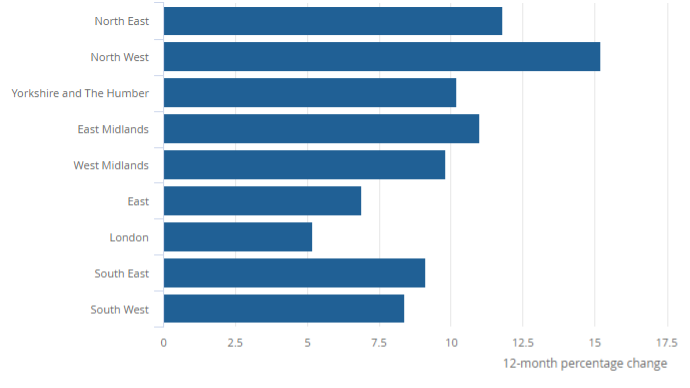
Source: ONS
House price data comparison
These are the figures from the leading five house price indices for June 2021:
| e-Surv | ONS | Nationwide | Halifax | Rightmove | ||||||
| A | M | A | M | A | M | A | M | A | M | |
| Jan-20 | ||||||||||
| Feb-20 | 2.2 | 0.8 | 0.9 | -0.3 | 2.3 | 0.2 | 2.8 | 0.1 | 2.9 | 0.8 |
| Mar-20 | 2.5 | 0.0 | 2.7 | 1.7 | 3.0 | 0.8 | 3.0 | 0.2 | 2.9 | 0.8 |
| Apr-20 | 1.7 | -1.0 | 0.9 | -1.8 | 3.7 | 1.1 | 2.7 | -0.6 | – | – |
| May-20 | 0.8 | -1.0 | 1.0 | 0.2 | 1.8 | -1.5 | 2.6 | -0.2 | – | – |
| Jun-20 | 0.8 | 0.0 | 2.3 | 1.2 | -0.1 | -1.5 | 2.5 | 0.0 | – | – |
| Jul-20 | 2.2 | 1.1 | 2.3 | 0.2 | 1.5 | 1.8 | 3.8 | 1.7 | 3.7 | 0.8 |
| Aug-20 | 3.8 | 1.5 | 3.1 | 1.0 | 3.7 | 2.0 | 5.2 | 1.7 | 4.6 | -0.2 |
| Sep-20 | 4.7 | 1.4 | 4.5 | 1.6 | 5.0 | 0.9 | 7.3 | 1.5 | 5.0 | 0.2 |
| Oct-20 | 5.8 | 1.8 | 5.7 | 1.2 | 5.8 | 0.3 | 7.5 | 0.3 | 5.5 | 1.1 |
| Nov-20 | 6.7 | 1.2 | 7.0 | 1.2 | 6.5 | 0.9 | 7.6 | 1.0 | 6.3 | -0.5 |
| Dec-20 | 7.7 | 1.2 | 8.6 | 1.5 | 7.3 | 0.9 | 6.0 | 0.0 | 6.6 | -0.6 |
| Jan-21 | 8.2 | 1.0 | 8.0 | 0.8 | 6.4 | -0.2 | 5.4 | -0.4 | 3.3 | -0.9 |
| Feb-21 | 8.6 | 1.1 | 9.2 | 1.2 | 6.9 | 0.7 | 5.2 | -0.1 | 3.0 | 0.5 |
| Mar-21 | 9.8 | 0.7 | 9.9 | 0.7 | 5.7 | -0.3 | 6.5 | 1.1 | 2.7 | 0.8 |
| Apr-21 | 11.7 | 0.7 | 9.6 | -0.3 | 7.1 | 2.1 | 8.2 | 1.4 | 5.1 | 2.1 |
| May-21 | 13.4 | 0.5 | 10.0 | 0.7 | 10.9 | 1.8 | 9.5 | 1.3 | 6.7 | 1.8 |
| Jun-21 | 10.7 | -2.7 | – | – | 13.4 | 2.5 | 8.8 | -0.7 | 7.5 | 0.8 |
Key: A = Annual M = Monthly
House Price Digest FAQ
The figures for average house prices and movements in property values can be confusing if you don’t know how to read the data.
Here are some of the most asked questions about house price indices.
Why are the average property prices different in each report?
The reports use different data to draw their conclusions and take the data from different periods.
The Nationwide and Halifax base their indices on customer data, which are much smaller samples than the national data analysed by the ONS.
Acadata’s methodology includes analysis that no other index uses.
Each organisation collects data over different periods, making a direct comparison difficult.
What is the average house price?
There’s no such thing as an average home. The figure is simply math calculated from the total value of all transactions in the sample divided by the number of homes changing hands.
Which house price index is the best?
All have flaws because of the restricted data they use, but the one with the broadest sample comes from the ONS. Unfortunately, however, the ONS data is usually the last to market and out of date by three months on publication.
More information
We have more investing in property information for England and Wales.