

Rents are still rising across the country despite the impact of the COVID-19 pandemic on the economy and jobs, according to the latest official data.
The amount tenants pay has firmly stuck at a yearly increase of 1.4% to 1.5% for a year says the Office for National Statistics (ONS), although other measures show much higher increases for some areas.
Fixing rents at the right level to attract tenants is a key task for landlords.
To see how rents are performing in your area, here’s a round up of the latest data.
Contents
ONS Rents – September 2020
The ONS Index of Private Housing Rental Prices is the government’s official tracker of UK rents, published monthly.
The data is based on the rents of more than 500,000 private homes across the UK and shows average buy to let rents increased by 1.5% for the year to the end of September – the same rate as August.
That means a home renting out for £500 in September 2019 now costs £507.50p a month.
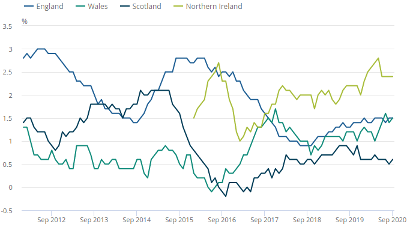
Nationally, the rate for England and Wales was up 1.5%, but was lower in Scotland at 0.6%.
Excluding London prices, rents across the rest of England were up 1.6%.
London rents increased by 1.2%, slightly down for 1.3% in August.
Between January 2015 and September rents were up 9.6%.
Rent increases by country – September 2012 to September 2020
Source: ONS
Rents by region in England
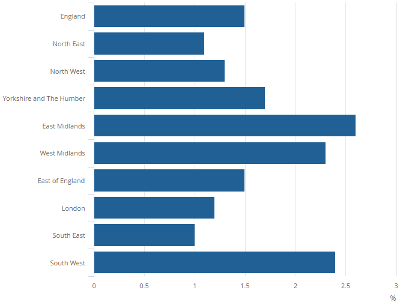
Landlords in the East Midlands enjoyed the biggest rent increases in the past year – up 2.6% from 2.4% in August.
The next largest increase was in the South West, at 2.4%, down from 2.5% a month earlier.
The lowest rent rises were in the North East and the South East, both up 1% and sticking at the same annual rise as seen in August.
Rent increase in England – year to September 2020
Source: ONS
Check median rents for your local authority for different property types with this interactive map.
Source: ONS
Rent statistics from other sources
Several property businesses and other organisations produce their own rent statistics.
Here is a digest of some of the data:
Homelet Rental Index – September 2020
Tenant referencing firm Homelet reports average monthly rents for new tenancies across the UK in September rose to £987 a month, up 2.1% on a year earlier and 0.2% from August.
That’s a rise of £2 a month over August’s data.
Other takeaways from the report include:
- Average rents in London fell 2.8% in the year and 0.4% from August to £1,646 a month
- Excluding London, the average UK monthly rents were £828 – £3 and 2.1% compared to the previous year
Martin Totty, chief executive at HomeLet, said: “While it’s undoubtedly the case many landlords are being supportive of their tenants and agreeing temporary reductions or deferrals, it will be encouraging for them to see rents agreed on new tenancies, in almost all parts of the country, are continuing to hold up and generally edge forward.
“This is likely because tenant demand remains strong whilst supply may be a little more constrained if some landlords are selling into a stronger sales market, even if that could be a short term phenomenon. It also doesn`t help tenants much if, for them, the prospect of securing first time mortgage finance remains as elusive as ever.
“So, those landlords committed to the sector for the long term and having shown their willingness to confront the multiple headwinds of: taxation change; new regulatory requirements; and, in certain circumstances, longer notice periods to gain possession of their properties, may still be rewarded for their flexibility and their perseverance with reasonable returns on their investment risk.”
Homelet Rental Index by region – September 2020
| Region | September 2020 Rents | August 2020 Rents | Monthly Change | September 2019 Rents | Annual Change |
| Greater London | £1,646 | £1,653 | -0.4% | £1,694 | -2.8% |
| South East | £1,074 | £1,070 | 0.4% | £1,045 | 2.8% |
| East Of England | £967 | £954 | 1.4% | £927 | 4.3% |
| South West | £902 | £899 | 0.3% | £846 | 6.6% |
| North West | £770 | £781 | -1.4% | £739 | 4.2% |
| West Midlands | £747 | £739 | 1.1% | £718 | 4.0% |
| Scotland | £683 | £692 | -1.3% | £676 | 1.0% |
| East Midlands | £678 | £670 | 1.2% | £653 | 3.8% |
| Yorkshire & Humberside | £673 | £678 | -0.7% | £657 | 2.4% |
| Northern Ireland | £657 | £668 | -1.6% | £673 | -2.4% |
| Wales | £650 | £641 | 1.4% | £634 | 2.5% |
| North East | £558 | £546 | 2.2% | £535 | 4.3% |
| UK | £987 | £985 | 0.2% | £967 | 2.1% |
| UK excluding Greater London | £828 | £825 | 0.4% | £797 | 3.9% |
Source: Homelet
Read the September 2020 Homelet rents report
Royal Institution of Chartered Surveyors (RICS)
The RICS UK Residential Market Survey for September 2020 reports tenant demand rising for the fourth month running.
“London now stands out as the only area in which a negative trend in tenant demand was cited in September,” says the report.
“This recent dip in demand has been reflected in short-term rental growth expectations across the capital, with a net balance of -67% of contributors anticipating rents in London will fall over the next three months.
“In contrast, the national three-month rental expectations indicator returned a positive reading.”
Guild of Landlords Rent Digest – FAQ
For landlords confused by the stats and what they mean, here are some answers to the most asked questions about rents.
Why do the rent indices show different results?
Check the data carefully. Different indices cover different periods, and the samples vary between reports.
The ONS has the biggest sample, so should return the most reliable figures, but the time taken to collect and analyse the statistics often means the ONS data lags the rest of the sector.
ARLA derives insights from letting agents and provides what’s known in the trade as a sentiment survey rather than solid data.
Homelet statistics are based on customer data, which may not fully reflect the market.
Should landlords raise rents in line with the stats?
That’s a business decision for landlords. The rent statistics are an indication of how the market is moving but do not reflect demand from tenants and property standards in local neighbourhoods
Don’t forget the data is historical, so gives a picture of what’s happened rather than what will happen.
Which rent index is the best?
That’s up to individual landlords. One index with a strong customer base in the same area as a landlord’s portfolio may align more closely with market rents for that neighbourhood, for instance.
Average data is not much good if you don’t have an average home and median rents will cover everything from a room in a shared house to a four-bedroom home.
Extra research with local letting agents is likely to give a better view of where a landlord should pitch a competitive rent and stop them from underselling.
Although several letting agents and property organisations publish regular rent statistics, many have been affected by the coronavirus lockdown that has their reports suspended or delayed.