

According to the latest official data, buy to let rents are rising at the fastest rate since December 2016.
The Office for National Statistics says rents were up by 2.3 per cent in the year to the end of February – the most significant annual rise for more than five years.
Rents increased by at least a 2.3 per cent annual increase in every region but London.
The capital returned a miserable 0.2 per cent rise.
The ONS breaks statistics into national and regional bundles.
The annual rise for England was 2.1 per cent – the highest rate since March 2017. Excluding London from the data saw a 3.1 per cent rise across the rest of the country, which the ONS says is the highest rate recorded since the agency started keeping records in 2006.
Rents in Wales (+1.4 per cent) and Scotland (+2.6 per cent) stayed the same as in January.
Contents
Rent changes by region – February 2022
The East Midlands and South West have led the charge towards higher rents for the past year.
One or other of the regions has taken the top spot each month.
The East Midlands was ahead in February with an average annual rent rise of 3.8 per cent, ahead of the South West and East of England on 3.5 per cent.
London has the highest rents but the lowest rent growth – just 0.2 per cent.
The next poorest performing region was the North East, where rents improved by 2.3 per cent.
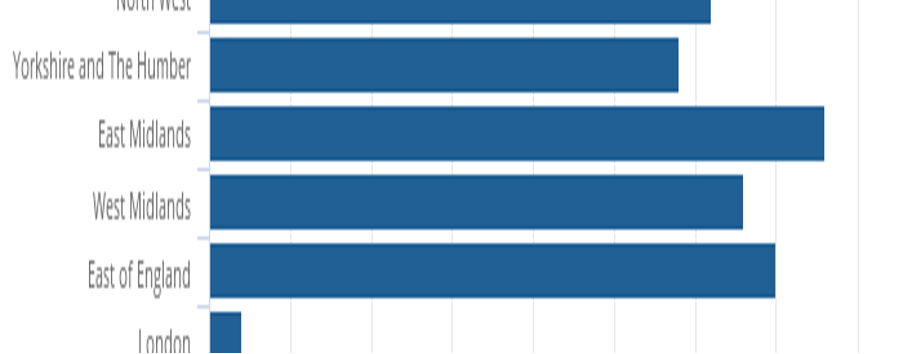
Source: ONS
Average UK rent tops £1,000 a month
Tenant referencing firm Homelet says the average UK private rent is now £1,069 a month – up 8.6 per cent in a year and 0.5 per cent since January.
Rents in London are much higher – averaging £1,757 a month; even though they have dropped 0.2 per cent in a month, they are 11.8 per cent up on the same time last year.
CEO Andy Halstead said: “The second month of 2022 followed largely similar trends to the first, with the average rental price across the UK continuing to rise month-on-month. The housing supply required to meet the demand sadly isn’t there, so as far as we can tell, this is a trend that will continue to appear throughout 2022, barring an unexpected change.
“It is interesting to see Greater London record a small dip after a sustained period of resurgence, albeit the dip is a relatively small one.
“The cost of living crisis is likely to intensify as the months tick over, due to inflation and rising energy prices, making it more important than ever for landlords to consider rent protection products to ensure that they are sufficiently protected against the unpredictable nature of the current situation.”
How rents have changed where you are
Homelet claims rents have dropped in two regions this month – London and the East Midlands.
Over the past year, only Scotland, the North West and London have seen double-digit increases.
| Region | Feb-22 | Feb-21 | Yearly change | Jan-22 | Monthly Change |
| East Midlands | £745 | £651 | 5.80% | £746 | -0.10% |
| East of England | £1,037 | £978 | 6.00% | £1,035 | 0.20% |
| Greater London | £1,757 | £1,572 | 11.80% | £1,760 | -0.20% |
| North East | £583 | £542 | 7.60% | £578 | 0.90% |
| North West | £860 | £782 | 10.00% | £855 | 0.60% |
| Scotland | £760 | £678 | 12.10% | £747 | 1.70% |
| South East | £1,139 | £1,018 | 4.80% | £1,128 | 1.00% |
| South West | £999 | £914 | 8.80% | £989 | 1.00% |
| Wales | £727 | £673 | 8.00% | £727 | 0.00% |
| West Midlands | £800 | £749 | 6.80% | £792 | 1.00% |
| Yorkshire & Humberside | £730 | £680 | 7.40% | £26 | 0.60% |
| UK | £1,069 | £984 | 8.60% | £1,064 | 0.50% |
| UK excluding Greater London | £902 | £840 | 7.40% | £897 | 0.60% |
Source: Homelet
Guild of Landlords Rent Digest – FAQ
For landlords confused by the stats and what they mean, here are answers to the most asked questions about rents.
Why do the rent indices show different results?
Check the data carefully. Other indices cover different periods, and the samples vary between reports.
The ONS has the most extensive sample, so the most reliable figures should return, but the time to collect and analyse the statistics often means the ONS data lags behind the rest of the sector.
ARLA derives insights from letting agents and provides what’s known in the trade as a sentiment survey rather than factual data.
Homelet statistics come from customer data, which may not fully reflect the market.
Should landlords raise rents in line with the stats?
That’s a business decision for landlords. The rent statistics indicate how the market moves but do not reflect demand from tenants and property standards in local neighbourhoods.
Don’t forget the historical data, giving a picture of what’s happened rather than what will happen.
Which rent index is the best?
That’s up to individual landlords. For instance, one index with a solid customer base in the same area as a landlord’s portfolio may align more closely with market rents for that neighbourhood.
Average data is not good if you don’t have an average home, and median rents will cover everything from a room in a shared house to a four-bedroom home.
Extra research with local letting agents is likely to indicate better where a landlord should pitch a competitive rent and stop them from underselling.
Although several letting agents and property organisations publish regular rent statistics, many have been affected by the coronavirus lockdown that has their reports suspended or delayed.
More information
We have more investing in property information for England and Wales.
See more articles from the statistics category here.