

The buy to let profit gap has never looked wider as landlords in the South cash in their investments with profits of more than £100,000, while those in the North make so little, they pay no tax.
London landlords capitalise the most on selling investment properties, earning gains averaging £300,000 on a sale.
Meanwhile, those in the North East fared the worst with gains averaging just £11,310.
The data comes from research by letting agent Hamptons, which reveals the property profit gap is split in three – with the South and London on top, followed by the Midlands and Wales and then trailed by the North.
Below is a deeper dive into the statistics that shows the detail.
Contents
Gains for Northern landlords too small to tax
Landlords selling investment property hit the lowest mark since 2014 with 131,900 homes changing hands, although difficulties in selling due to the COVID-19 pandemic and a letting ban may have influenced the figure.
But although property investors saw huge gains on the value of their properties, the state of the market means they were lower than between 2016 to 2018.
Across the UK, the average buy to let sold for £82,450 which realised a 42% gain in value after ownership for 9.1 years.
In London, landlords sold for an average £302,000, a gain of 71% after 9.8 years of ownership.
In the North East, the average landlord pulled in a £11,310 gain – capital growth of 16% after owning a home for eight years.
More than a third of landlords (37%) in the North East paid no capital gains tax when selling a rental home as their profit falls below the annual £12,300 tax-free CGT allowance, while profits in the capital pushed selling landlords into the higher rate tax brackets and 91% enjoyed a gain of more than the CGT allowance.
In fact, 36% of landlords in the North East sold their buy to lets at a loss.
While 77% of landlords across the UK paid CGT on their gains, the figure was reversed in the North East, where 77% paid no CGT.
“Despite the increase, typically landlords who sold in the capital last year made a smaller gross profit than those who sold in 2016 when they made an average gain of £364,960. 2016 marked the high point for landlord profit when many investors, having bought at the bottom of the market following the 2008 financial crash, decided to sell up,” said the report.
Average gains on buy to let sales 2016 – 2020
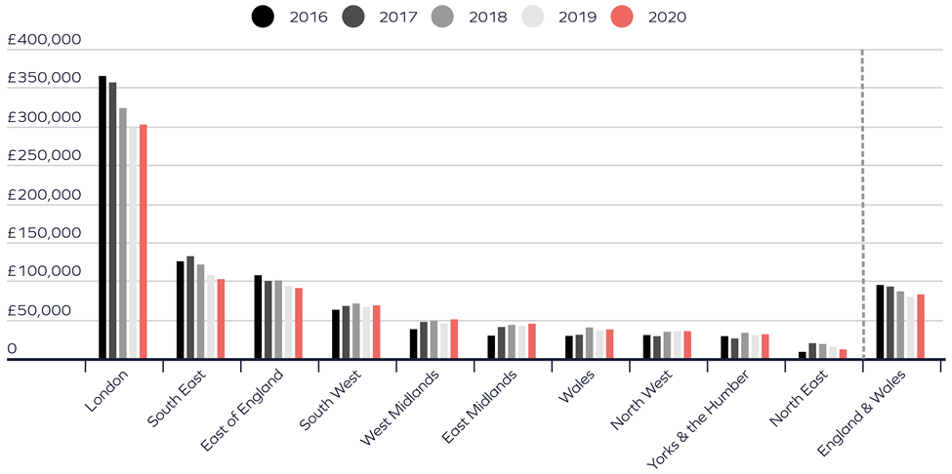
Source: Hamptons
The buy to let profit gap revealed
Property prices clearly split England and Wales into three bands last year, with the lowest gains the farthest north landlords were from the capital.
London, the South East, East and South West all outperformed the Midlands, while the Midlands beat the North.
Wales performed slightly better than the North but not as well as the Midlands.
Longevity also paid a part in making a profit on property.
Landlords who have owned their buy to lets for 15 years or more made three times the profit of landlords selling after ownership of five years or less.
The top 10 local authority areas where landlords posted the biggest gains in 2020 were all in London.
Plush Kensington & Chelsea topped the list with an average 10 year gain of £784,980. Next came Camden, Westminster then Hammersmith and Fulham, where landlords made average gains of more than £500,000 on each home sold.
Average landlord gains 2020
| Region | Average gain | Year -on Year change | Average years owned | |
| London | £302,200 | £3,760 | 1% | 9.8 |
| South-East | £102,200 | -£5,380 | -5% | 9.2 |
| East of England | £90,590 | -£2,630 | -3% | 8.9 |
| South West | £68,250 | £2,160 | 3% | 8.6 |
| West Midlands | £50,240 | £5,220 | 12% | 9.0 |
| East Midlands | £44,560 | £2,960 | 7% | 9.1 |
| Wales | £37,120 | £1,170 | 3% | 9.6 |
| North West | £34,780 | £170 | 0% | 9.0 |
| Yorkshire & Humber | £30,800 | £940 | 3% | 9.6 |
| North East | £11,310 | -£3,500 | -24% | 8.0 |
| England & Wales | £82,450 | £3,390 | 4% | 9.1 |
Source: Hamptons
While capital gains may have been lower in the North East, the market also saw the biggest share of landlord sales.
One in four homes sold were former private rentals – about 9,730 homes in total.
In comparison, the data from London revealed one in five homes were former rentals, numbering around 18,920 properties.
Why did landlord sales peak?
Landlord buy to let sales peaked in 2016 probably for two reasons.
First, around this time the media was full of speculation about buy to let tax changes followed by the government announcing the phasing out of mortgage tax relief for higher rate taxpayers. The Hamptons report suggests landlords with poor yielding properties sold them soon after the announcement to avoid increased tax bills.
Secondly, the report says, landlords who bought property cheaply during the financial crisis cashed in after holding their investments for a decade.
Aneisha Beveridge, head of research at Hamptons, said: “Over the last few years, the average capital gain made by a landlord has been shrinking. But despite the pandemic, stronger house price growth seems to have reversed this trend. Landlords who have been in the game for longest have reaped the largest rewards.
“Despite the gradual easing of lockdown, the London vs rest of the country rental growth divide remains entrenched. Outside the capital would-be tenants are scrabbling over stock before it hits the portals, while in Central London landlords are chasing tenants just as relentlessly. There are however signs of tenants returning to Central London, with viewings up 64% year-on-year in March. But record high stock levels mean rents are unlikely to start recovering to pre-pandemic levels until later in the year.”
Landlord UK rental home sales: 2010 -2020
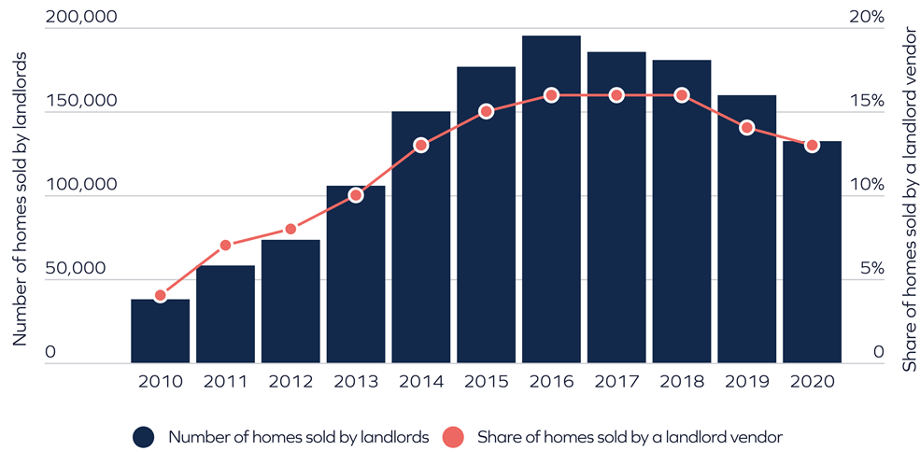
Source: Hamptons
More information
We have more investing in property information for England and Wales .