
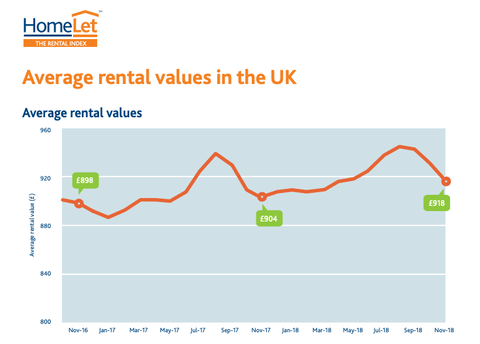
Private tenants were paying an average of 1.5% more in rent than a year ago, according to the latest data.
The average UK rent is £918 a month, says buy to let tracker Homelet.
But a more detailed breakdown shows rents fell year-by-year in the North East (-3.0%), Wales (-1.8%) and Yorkshire & Humberside (-0.2%).
The highest annual increase was in London, where rents were up 4.4% to an average £1,597 a month.
When London rent data is stripped out of the UK figures, average rents outside the capital rose by 0.9% to an average £760 a month.
Buy to let rents in London are 110% than the UK average.
In the capital, the highest rent rises were in Haringey and Islington, where tenants are paying 15.3% more year-on-year with an average rent of £1,730 a month. Several boroughs saw rents drop – Ealing (-3.5%), Barking, Dagenham and Havering (-3.4%) and Barnet and Bexley ( both -2.3%)
Renting a buy to let home was also more expensive for tenants also increased during the year to 30.8% of household earnings – up 2.6% from 12 months ago.
UK buy-to-let rents by region – November 2018
| Region | Average rent Nov 2018 | Average rent Oct 2018 | Monthly variance | Average rent Nov 2017 | Annual variance |
| East Midlands | £625 | £628 | -0.5% | £615 | 1.6% |
| East of England | £898 | £908 | -1.1% | £894 | 0.4% |
| Greater London | £1,597 | £1,619 | -1.4% | £1,530 | 4.4% |
| North East | £517 | £515 | 0.4% | £533 | -3.0% |
| North West | £694 | £697 | -0.4% | £685 | 1.3% |
| Northern Ireland | £639 | £653 | -2.1% | £621 | 2.9% |
| Scotland | £635 | £647 | -1.9% | £620 | 2.4% |
| South East | £989 | £1,010 | -2.1% | £976 | 1.3% |
| South West | £819 | £811 | 1.0% | £802 | 2.1% |
| Wales | £599 | £614 | -2.4% | £610 | -1.8% |
| West Midlands | £688 | £693 | -0.7% | £675 | 1.9% |
| Yorkshire & Humberside | £623 | £631 | -1.3% | £624 | -0.2% |
| UK | £918 | £928 | -1.1% | £904 | 1.5% |
Source: Homelet