
The housing market is surging to new levels as prices, demand and sales volumes hit new heights as shown in this house price digest May 2021.
The rush to jump on the property ladder or move to a bigger home is fuelling demand.
The latest official figures from the Office of National Statistics show a massive 10.2% jump in house prices for the 12 months to the end of March.
The hike in house prices has added £24,000 to the value of the average UK home in a year.
The rate of growth is the highest seen since August 2007, which was immediately before the slump induced by the global financial crisis of 2008.
An average house in England now costs £275,000, while in Wales the annual rise was 11% to £185,000, in Scotland, prices rose 10.6% to £167,000 and Northern Ireland posted a 6% increase to hit an average £149,000.
House prices in London remain in the doldrums, recording only a 3.7% increase – the lowest in the country for a fourth month in a row.
“The pandemic may have caused house buyers to reassess their housing preferences. In our data we have seen the average price of detached properties increase by 11.7% in the year to March 2021, in comparison with flats and maisonettes increasing by 5.0% over the same period,” said the ONS report.
“Changes in stamp duty tax paid on housing transactions may have allowed sellers to request higher prices as the buyers’ overall costs are reduced. “
Contents
English house prices by region – March 2021
Landlords in Yorkshire and Humberside saw the highest annual price growth in March. The average home added 14% in value in the year to March and 3% from February 2021.
House pries are falling in London, which saw the annual growth rate drop from 4.4% in February to 3.7% in March, but average house prices in the capital are still double those in any other region at £500,000.
The lowest average house prices can be found in the North East at £146,000 – still more than the peak reached in July 2007.
Regional house price changes March 2020 – March 2021
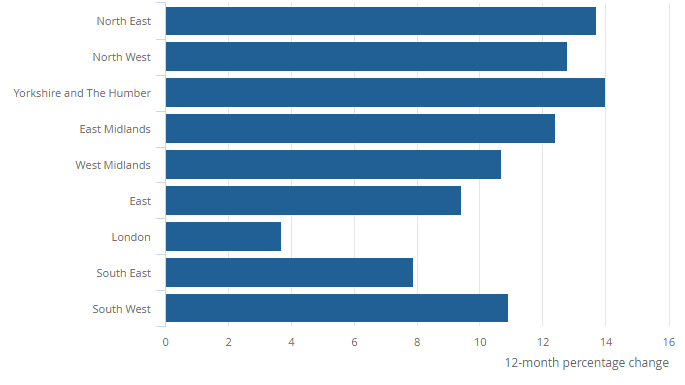
Source: ONS
Property Bubble Won’t Burst Just Yet
House prices still have several months of going up before a correction in the market, says a report from price tracking index Acadata.
“As the latest Acadata index shows, prices in March were rising by around 10% on an annual basis, prompting renewed talk of housing bubbles which might be about to burst,” said a spokesman for e.surv, which is based on the Acadata stats.
“Given that our index is based on completion prices, a comparison of indices suggests that- taking mortgage approval prices (Halifax and Nationwide) and asking prices (Rightmove) as crude forward indicators- we have at least several more months of continued price increases built in.”
| e-Surv | ONS | Nationwide | Halifax | Rightmove | ||||||
| A | M | A | M | A | M | A | M | A | M | |
| Apr-20 | 1.7 | -1.0 | 0.9 | -1.8 | 3.7 | 1.1 | 2.7 | -0.6 | – | – |
| May-20 | 0.8 | -1.0 | 1.0 | 0.2 | 1.8 | -1.5 | 2.6 | -0.2 | – | – |
| Jun-20 | 0.8 | 0.0 | 2.3 | 1.2 | -0.1 | -1.5 | 2.5 | 0.0 | – | – |
| Jul-20 | 2.2 | 1.1 | 2.3 | 0.2 | 1.5 | 1.8 | 3.8 | 1.7 | 3.7 | 0.8 |
| Aug-20 | 3.8 | 1.5 | 3.1 | 1.0 | 3.7 | 2.0 | 5.2 | 1.7 | 4.6 | -0.2 |
| Sep-20 | 4.7 | 1.4 | 4.5 | 1.6 | 5.0 | 0.9 | 7.3 | 1.5 | 5.0 | 0.2 |
| Oct-20 | 5.8 | 1.8 | 5.7 | 1.2 | 5.8 | 0.3 | 7.5 | 0.3 | 5.5 | 1.1 |
| Nov-20 | 6.7 | 1.2 | 7.0 | 1.2 | 6.5 | 0.9 | 7.6 | 1.0 | 6.3 | -0.5 |
| Dec-20 | 7.7 | 1.2 | 8.6 | 1.5 | 7.3 | 0.9 | 6.0 | 0.0 | 6.6 | -0.6 |
| Jan-21 | 8.2 | 1.0 | 8.0 | 0.8 | 6.4 | -0.2 | 5.4 | -0.4 | 3.3 | -0.9 |
| Feb-21 | 8.6 | 1.1 | 9.2 | 1.2 | 6.9 | 0.7 | 5.2 | -0.1 | 3.0 | 0.5 |
| Mar-21 | 9.8 | 0.7 | 10.2 | 1.0 | 5.7 | -0.3 | 6.5 | 1.1 | 2.7 | 0.8 |
| Apr-21 | 11.7 | 0.7 | – | – | 7.1 | 2.1 | 8.2 | 1.4 | 5.1 | 2.1 |
Key: A = Annual change, M = Monthly Change
Asking Prices Hit New High
Property portal Rightmove has issued statistics showing sellers are asking record highs for their homes.
The average UK asking price is now £333,564, which is 1.8% above the previous peak set only a month ago.
The property web site also explained demand from buyers is outstripping supply of homes to sell even though the number of properties advertised is around the expected level for the time of year.
Tim Bannister, Rightmove’s Director of Property Data said: “Last year’s unexpected mini-boom is rolling on into 2021, with new price and market activity records again defying many predictions. Buyer affordability is increasingly stretched, but there’s obviously some elasticity left to stretch a bit more as many buyers are squeezing their way into higher price bands.
“This high demand, with both willingness and ability to pay more, has pushed the average price of property coming to market to a new all-time high of a third of a million pounds.
“In another twist, it is the regions of Britain further north that are leading the way, with some degree of catching up between average prices in London and the north. While the gap remains large, with average prices in London still 2.9 times higher than those in the north, this ratio is now at its smallest since 2013.
“The pandemic has given a greater focus on the home, and in 2020 we saw a surge in southern coastal and rural areas. So far 2021 is proving to be the year of the northern mover, not only satisfying their pent-up housing needs, but in doing so also narrowing some of the huge price gap with London.”
House Price Digest FAQ
The figures for average house prices and movements in property values can be confusing if you don’t know how to read the data.
Here some of the most asked questions about house price indices.
Why are the average property prices different in each report?
The reports use different data to draw their conclusions and take the data from different periods.
The Nationwide and Halifax indices are based on their customer data, which are much smaller samples than the national data analysed by the ONS.
Acadata’s methodology includes analysis that no other index uses.
Each organisation collects data over different time periods – the Nationwide and Halifax are for the year to September, while the ONS is to the end of July.
What is the average house price?
There’s no such thing as an average home. The figure is simply math calculated from the total value of all transactions in the sample divided by the number of homes changing hands.
Which house price index is the best?
They are all flawed because of the nature of the restricted data they are based on, but the one with the broadest sample comes from the ONS. However, the ONS data is usually the last to market and out of date by three months on publication.
More information
We have more investing in property information for England and Wales.