

As the curtain comes down on the stamp duty holiday, asking prices for homes have reached an all-time high.
Strong demand from buyers tempered by a shortage of homes for sale is keeping the market buoyant, according to property portal Rightmove.
Although prices only rose 0.3 per cent, the average home is now worth £338,462 – £1,091 more than last month but only £15 higher than the old record set in July.
Overall, Rightmove suggests house prices are stabilising and double-digit growth seen in the past year or more is about to end.
This levelling of the market coincides with the end of the stamp duty holiday on September 30.
From October 1, stamp duty reverts to normal rates
Tim Bannister, Rightmove’s director of property data, said: “New sellers dropping their asking prices can ring economy alarm bells, especially when it’s the first time so far this year, so it’s important to dig underneath the headline figures.
“Firstly, we are in the holiday season, which means that sellers have traditionally tempted distracted buyers with lower prices, though that might well be less applicable this year with many buyers having to stay a lot closer to home.
“Our analysis shows that average prices have only fallen in the upper-end sector, which is usually more affected by seasonal factors such as the summer holidays and has also seen the greatest withdrawal of stamp duty incentives. However, the mass-market of properties that cater for first-time buyers and second-steppers is still seeing high demand and upwards price pressure leading to a new record high average prices in those sectors.”
Contents
House prices hit new high
Average house prices in England are at the highest ever – up to seven per cent to £271,000.
In Wales, homeowners enjoyed an 11.6 per cent annual boost to rise to £188,000, while in Scotland, average house prices surged 14.6 per cent to £177,000.
However, London disappointed again for the eighth month in a row, according to house price data from the Office for National Statistics.
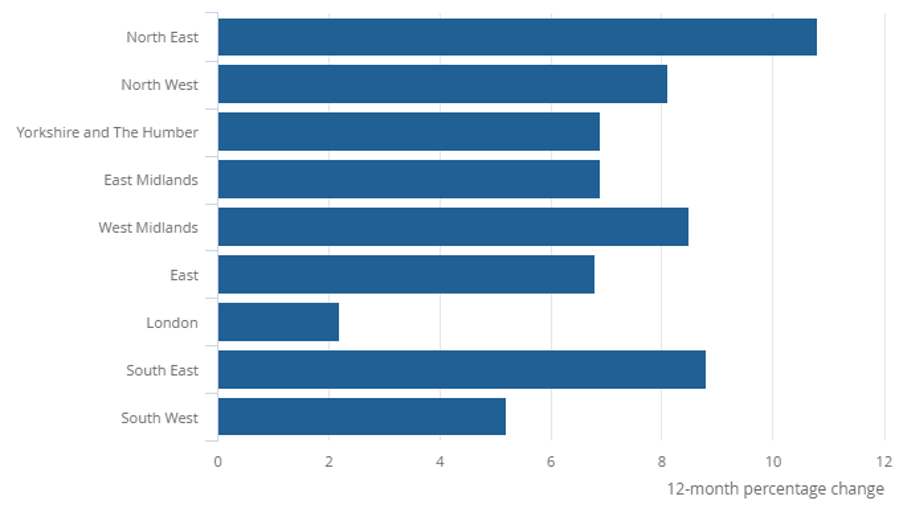
In the capital, prices were up just 2.2 per cent in a year – the lowest regional return for the UK.
“As the tax breaks were due to conclude at the end of March 2021, it is likely that March’s average house prices were slightly inflated as buyers rushed to ensure their house purchases were scheduled to complete ahead of this deadline,” said the ONS report.
“This effect was further exaggerated in June 2021, in line with the extension to the holiday on taxes paid on property purchases in England, Wales and Northern Ireland. As a result, average house prices for July returned to similar levels seen earlier in the year.”
English house prices by region – September 2021
House prices are rising the fastest in the North West, with a year-on-year 18.6 per cent increase, says the ONS.
Overall, prices are rising faster in the Midlands and North than in London and the South.
Source: ONS
House price data comparison
These are the figures in per cent from the leading five house price indices for September 2021:
| e-Surv | ONS | Nationwide | Halifax | Rightmove | |||||||||
| A | M | A | M | A | M | A | M | A | M | ||||
| Feb-20 | 2.2 | 0.8 | 0.9 | -0.3 | 2.3 | 0.2 | 2.8 | 0.1 | 2.9 | 0.8 | |||
| Mar-20 | 2.5 | 0.0 | 2.7 | 1.7 | 3.0 | 0.8 | 3.0 | 0.2 | 2.9 | 0.8 | |||
| Apr-20 | 1.7 | -1.0 | 0.9 | -1.8 | 3.7 | 1.1 | 2.7 | -0.6 | – | – | |||
| May-20 | 0.8 | -1.0 | 1.0 | 0.2 | 1.8 | -1.5 | 2.6 | -0.2 | – | – | |||
| Jun-20 | 0.8 | 0.0 | 2.3 | 1.2 | -0.1 | -1.5 | 2.5 | 0.0 | – | – | |||
| Jul-20 | 2.2 | 1.1 | 2.3 | 0.2 | 1.5 | 1.8 | 3.8 | 1.7 | 3.7 | 0.8 | |||
| Aug-20 | 3.8 | 1.5 | 3.1 | 1.0 | 3.7 | 2.0 | 5.2 | 1.7 | 4.6 | -0.2 | |||
| Sep-20 | 4.7 | 1.4 | 4.5 | 1.6 | 5.0 | 0.9 | 7.3 | 1.5 | 5.0 | 0.2 | |||
| Oct-20 | 5.8 | 1.8 | 5.7 | 1.2 | 5.8 | 0.3 | 7.5 | 0.3 | 5.5 | 1.1 | |||
| Nov-20 | 6.7 | 1.2 | 7.0 | 1.2 | 6.5 | 0.9 | 7.6 | 1.0 | 6.3 | -0.5 | |||
| Dec-20 | 7.7 | 1.2 | 8.6 | 1.5 | 7.3 | 0.9 | 6.0 | 0.0 | 6.6 | -0.6 | |||
| Jan-21 | 8.2 | 1.0 | 8.0 | 0.8 | 6.4 | -0.2 | 5.4 | -0.4 | 3.3 | -0.9 | |||
| Feb-21 | 8.6 | 1.1 | 9.2 | 1.2 | 6.9 | 0.7 | 5.2 | -0.1 | 3.0 | 0.5 | |||
| Mar-21 | 9.8 | 0.7 | 9.9 | 0.7 | 5.7 | -0.3 | 6.5 | 1.1 | 2.7 | 0.8 | |||
| Apr-21 | 11.7 | 0.7 | 9.6 | -0.3 | 7.1 | 2.1 | 8.2 | 1.4 | 5.1 | 2.1 | |||
| May-21 | 13.4 | 0.5 | 10.0 | 0.7 | 10.9 | 1.8 | 9.5 | 1.3 | 6.7 | 1.8 | |||
| Jun-21 | 10.7 | -2.7 | 13.2 | 4.5 | 13.4 | 2.5 | 8.8 | -0.7 | 7.5 | 0.8 | |||
| Jul-21 | 9.1 | 0.9 | 8.0 | -5.1 | 10.5 | -0.5 | 7.6 | 0.4 | 5.7 | 0.7 | |||
| Aug-21 | 5.0 | -1.4 | – | – | 11.0 | 2.1 | 7.1 | 0.7 | 5.6 | -0.3 | |||
Key: A = Annual M = Monthly
House Price Digest FAQ
The figures for average house prices and movements in property values can be confusing if you don’t know how to read the data.
Here are some of the most asked questions about house price indices.
Why are the average property prices different in each report?
The reports use different data to draw their conclusions and take the data from different periods.
The Nationwide and Halifax base their indices on customer data, which are much smaller samples than the national data analysed by the ONS.
Acadata’s methodology includes analysis that no other index uses.
Each organisation collects data over different periods, making a direct comparison difficult.
What is the average house price?
There’s no such thing as an average home. The figure is simply math calculated from the total value of all transactions in the sample divided by the number of homes changing hands.
Which house price index is the best?
All have flaws because of the restricted data, but the one with the broadest sample comes from the ONS. Unfortunately, the ONS data is usually the last to market and out of date by two to three months on publication.
More information
We have more investing in property information for England and Wales.
See more articles from the statistics category here.