
Property prices soared by more than 7% in the past year as Britain’s housing bonanza shows no signs of stopping any time soon.
The Halifax reports the average home sale was £249,870 in September as prices jumped by 7.3% – the biggest rise since 2016.
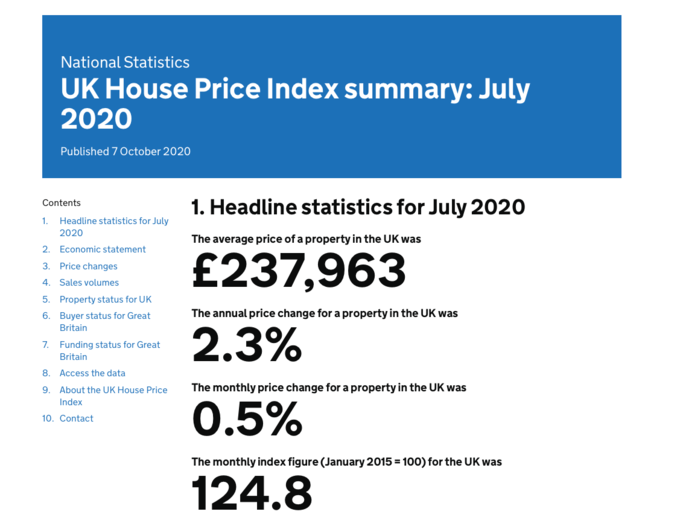
Meanwhile, the latest official data from the Office for National Statistics (ONS) shows the UK annual price rise as 2.3% and an average property price of £237,963.
The data inconsistencies are because both sets of figures are for different periods – the Halifax data is for the year ending September, while the ONS index is for the year to July.
Contents
Mortgage applications hit 12 year high
The Bank of England revealed 84,715 mortgage applications were received by lenders in August – a 28% rise on the previous month and 29% higher than 12 months earlier – the highest level since October 2007 before the financial crisis hit the global economy.
Halifax house price data
- Average house price: £249,870
- Monthly house price change: 1.6%
- Yearly house price change: 7.3%
- Period: Year to end of September 2020
Russell Galley, the bank’s managing director, said: “The average UK house price is now approaching £250,000 after September saw a third consecutive month of substantial gains. The annual rate of change will naturally draw attention, with the increase of 7.3% the strongest since mid-2016. Context is important with the annual comparison, however, as September 2019 saw political uncertainty weigh on the market.
“Few would dispute that the performance of the housing market has been extremely strong since lockdown restrictions began to ease in May. Across the last three months, we have received more mortgage applications from both first time buyers and home movers than any time since 2008.
“There has been a fundamental shift in demand from buyers brought about by the structural effects of increased home working and a desire for more space, while the stamp duty holiday is incentivising vendors and buyers to close deals at pace before the break ends next March.”
Galley also warned the house market boom is likely temporary and prices will fall as the economy is gripped by unemployment as the government furlough aid drops off in the months to come.
Nationwide house price data
- Average house price: £224,337
- Monthly house price change: 0.9%
- Yearly house price change: 3.5%
- Period: Year to end of September 2020
“Research indicates that, of the people that had been considering a move before the pandemic, 19% have put their plans on hold, with over a quarter (27%) of these citing concerns about the property market,” said Nationwide’s chief economist Robert Gardner.
“Younger people were much more likely to have put off plans than older people, which may reflect concerns about employment prospects.
“Indeed, most forecasters expect labour market conditions to weaken significantly in the quarters ahead as tighter restrictions dampen economic activity and the furlough scheme winds down. While the recently announced jobs support scheme will provide some assistance, it is not as comprehensive as the furlough scheme it replaces.
“But the pandemic may be spurring an even greater number of potential home movers into action.”
Read the full Nationwide report
ONS house price data
- Average house price: £237,963
- Monthly house price change: 0.5%
- Yearly house price change: 2.3%
- Period: Year to end of July 2020
Average house prices in the UK increased by 2.3% in the year to July 2020, down from 2.9% in June 2020.
At the country level, the largest annual house price growth was recorded in Wales, increasing by 3.6% over the year to July 2020.
England saw house prices increase by 2.5% in the year to July 2020.
Scotland saw house prices increase by 0.4% in the year to July 2020.
UK annual house price change by country since July 2016
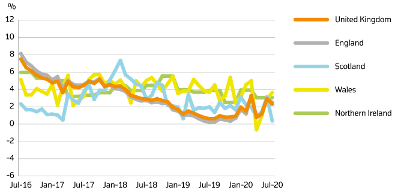
Source: ONS
UK house prices by region – July 2020

Source: ONS
UK house prices by property type
| Property type | July 2020 | July 2019 | Difference |
| Detached | £361,986 | £352,091 | 2.80% |
| Semi-detached | £227,832 | £220,307 | 3.40% |
| Terraced | £193,619 | £188,616 | 2.70% |
| Flat or maisonette | £205,702 | £206,741 | -0.50% |
| All | £237,963 | £232,618 | 2.30% |
Source: ONS
UK home sales volume (2016 – 2020)
Although property prices are increasing, the number of homes changing hands has dropped significantly this year.
The ONS data shows levels peaked in May 2017, when 87,737 homes were sold.
In May 2020, this had fallen to 32,248 – a 63% drop.
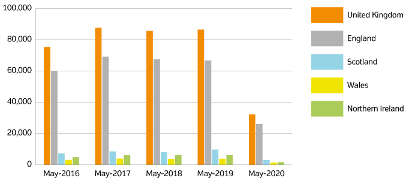
Source: ONS
Acadata house price data
- Average house price: £304,521
- Monthly house price change: 0.5%
- Yearly house price change: 1.5%
- Period: Year to end of July 2020
- The highest annual regional price rise was Wales at 2.9%
- Nottingham was the city with the highest annual growth – 10.3%
House Price FAQ
The figures for average house prices and movements in property values can be confusing if you don’t know how to read the data.
Here some of the most asked questions about house price indices.
Why are the average property prices different in each report?
The reports use different data to draw their conclusions and take the data from different periods.
The Nationwide and Halifax indices are based on their customer data, which are much smaller samples than the national data analysed by the ONS.
Acadata’s methodology includes analysis that no other index uses.
Each organisation collects data over different time periods – the Nationwide and Halifax are for the year to September, while the ONS is to the end of July.
What is the average house price?
There’s no such thing as an average home. The figure is simply math calculated from the total value of all transactions in the sample divided by the number of homes changing hands.
Which house price index is the best?
They are all flawed because of the nature of the restricted data they are based on, but the one with the broadest sample comes from the ONS. However, the ONS data is usually the last to market and out of date by three months on publication.